
Mr. Misbahuddin Saba is a Research Analyst specialising in real estate strategy and market intelligence at Reidin.
Four cycles of data reveal a market that has repeatedly recovered from disruption, each time with greater depth and resilience. Through H1 2026, the evidence points to a market that remains strong but is entering a more measured phase.
1. Dubai’s real estate cycles, a data led view
Dubai’s residential market has now lived through four distinct chapters, and REIDIN’s historical indices let us read them as one continuous story rather than a sequence of unrelated events. Citywide average sales prices climbed from roughly AED 500 per square foot in 2003 to a 2008 peak near AED 1,234, corrected sharply through the global financial crisis to a 2011 annual average around AED 843, then reached a 2014 peak of AED 1,487 per square foot.
The post 2014 cooling and the COVID trough of 2020, when prices eased to roughly AED 1,025 per square foot, completed the pattern. Each correction bottomed at a higher level, and each recovery carried prices to a new high. By December 2025, the index had reached AED 1,911 per square foot. It climbed further to AED 1,939 in February 2026 before easing to AED 1,856 in June. The June reading was still 1.9% higher than a year earlier, but 4.0% lower than in the previous quarter, suggesting that the market had entered a more measured phase.
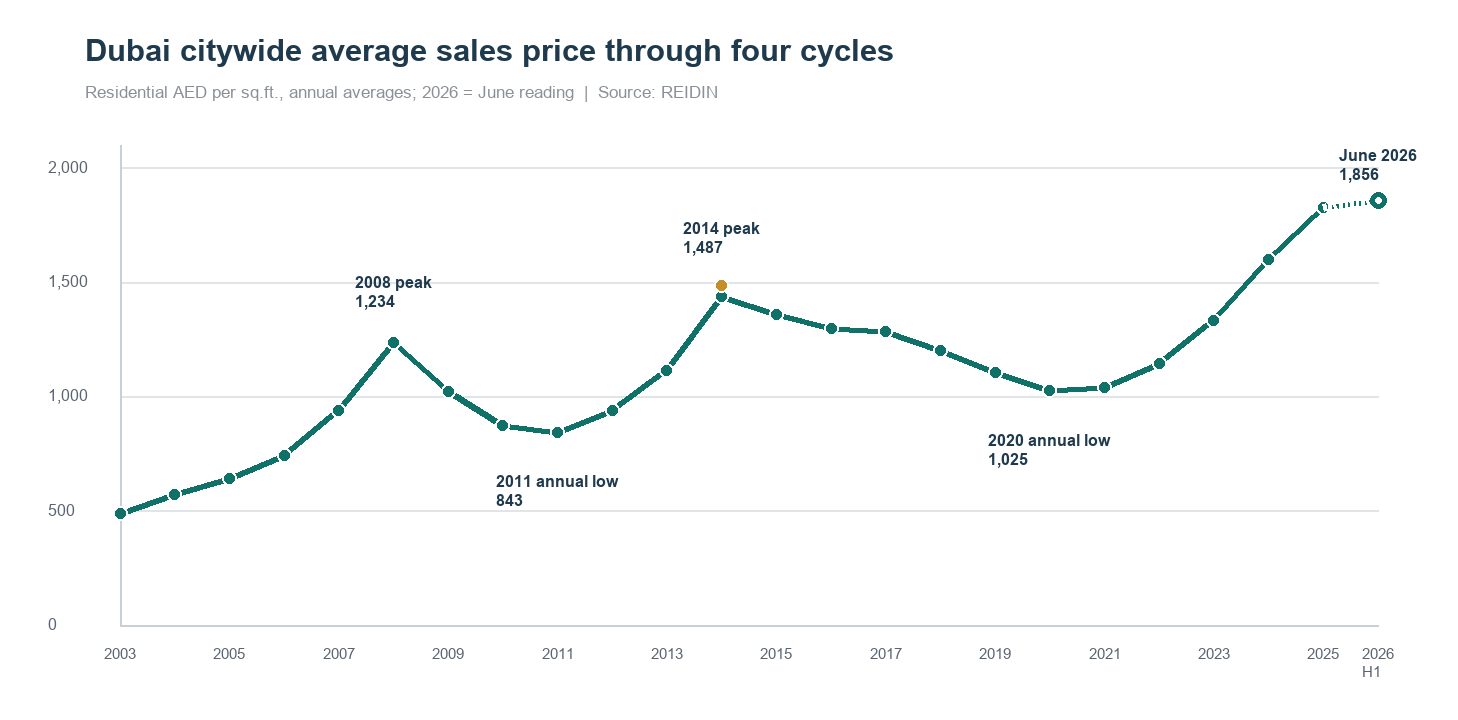
Figure 1. Citywide average residential sales price, 2003 to H1 2026. The long-cycle annotations are retained and the 2026 endpoint is updated.
2. Transaction resilience after disruption
Prices tell only half the story; activity tells the rest. Residential sales volumes fell to 31,936 deals in the 2020 disruption. By 2025 the market recorded 206,165 sales, rebuilding activity to a scale far beyond the previous cycle. H1 2026 added 81,861 transactions worth AED 225.7 billion. The half year total should not be compared mechanically with a full year, but it confirms that the market remains deep even as the monthly pace becomes less uniform.
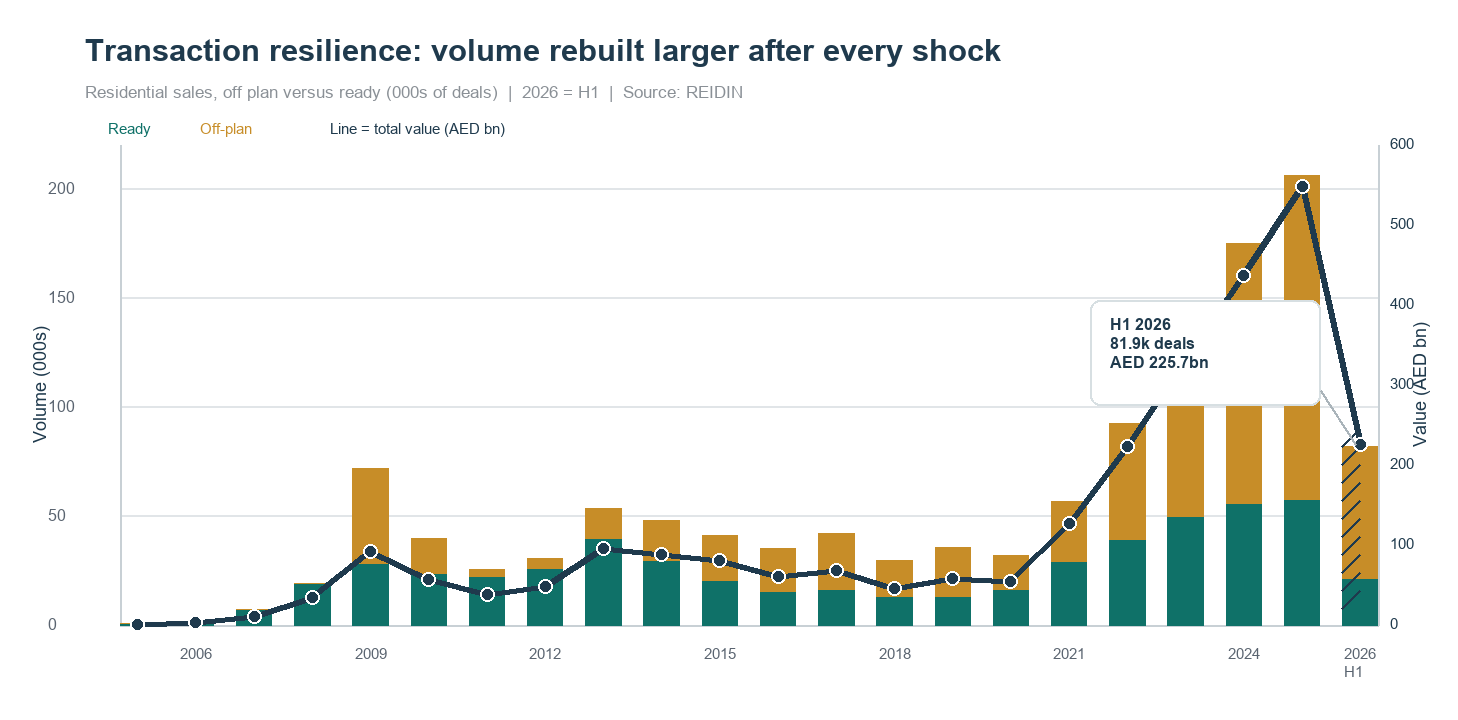
Figure 2. Sales volume (stacked bars) and total value (line), with H1 2026 shown as the hatched YTD observation.
The composition has shifted as well. Off-plan, which made up under half of sales volume in 2020, reached about 72% in 2025 and 74% in H1 2026. This is no longer a temporary spike but a structural feature of the modern market. It also means that delivery schedules, payment-plan performance and construction capacity matter more to the next phase than they did when ready sales dominated.
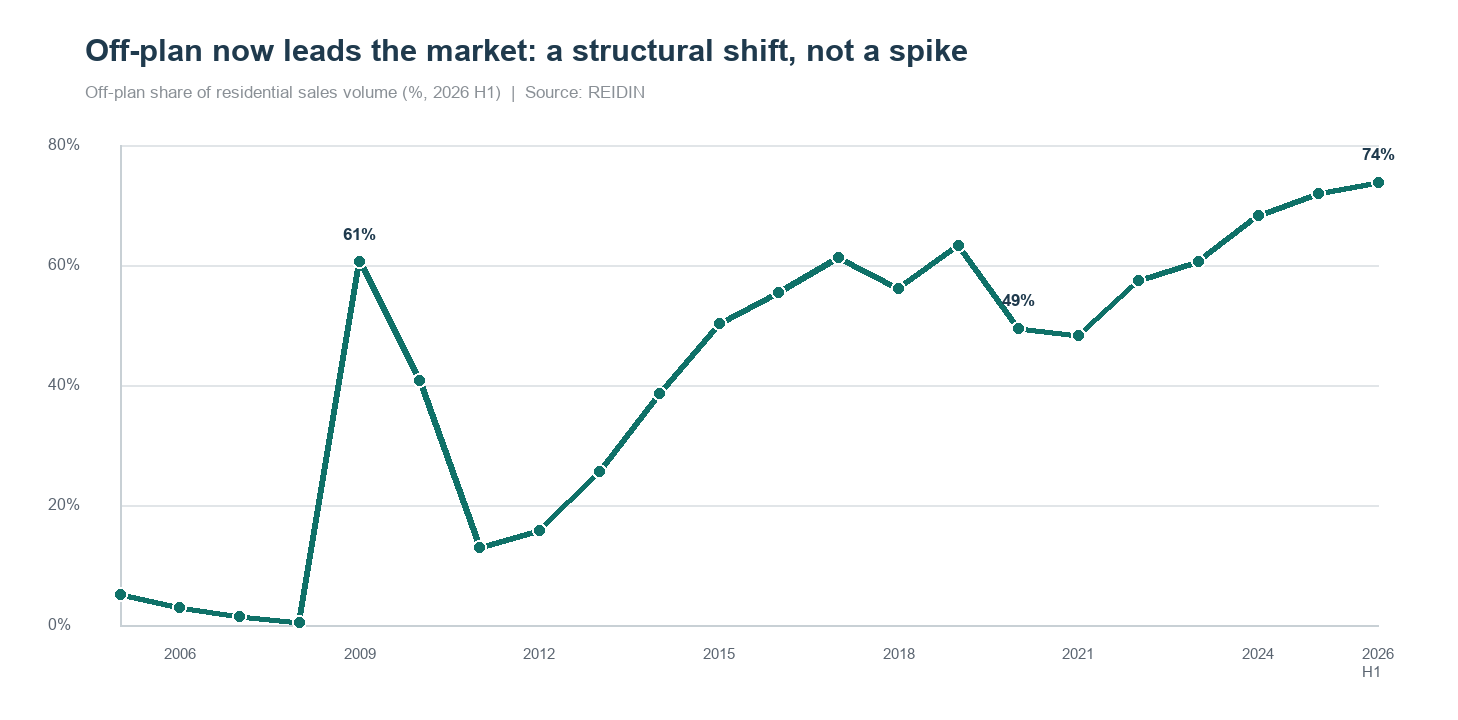
Figure 3 Off-plan share of sales volume, a structural feature of the modern market.
Mortgage-backed demand entered 2026 from a stronger base. Residential mortgage registrations reached 44,111 in 2025, nearly three times the 2020 total, while registered mortgage value reached AED 90.2 billion. In H1 2026, the market recorded 20,082 mortgage registrations worth AED 43.05 billion. The half year observation is shown separately because it is not directly comparable with a full calendar year.
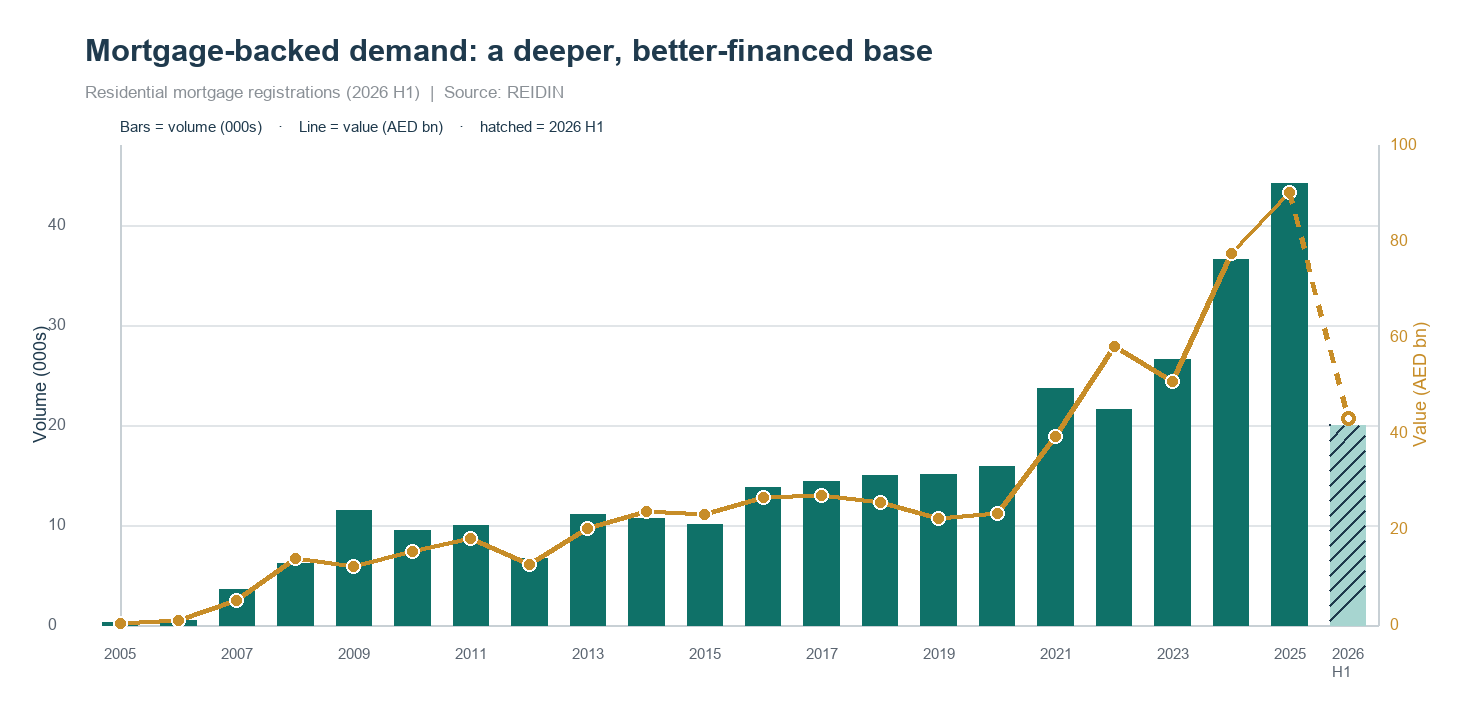
Figure 4. Mortgage volume and value. Financing depth has matured alongside the market.
3. Re-imagining development strategy
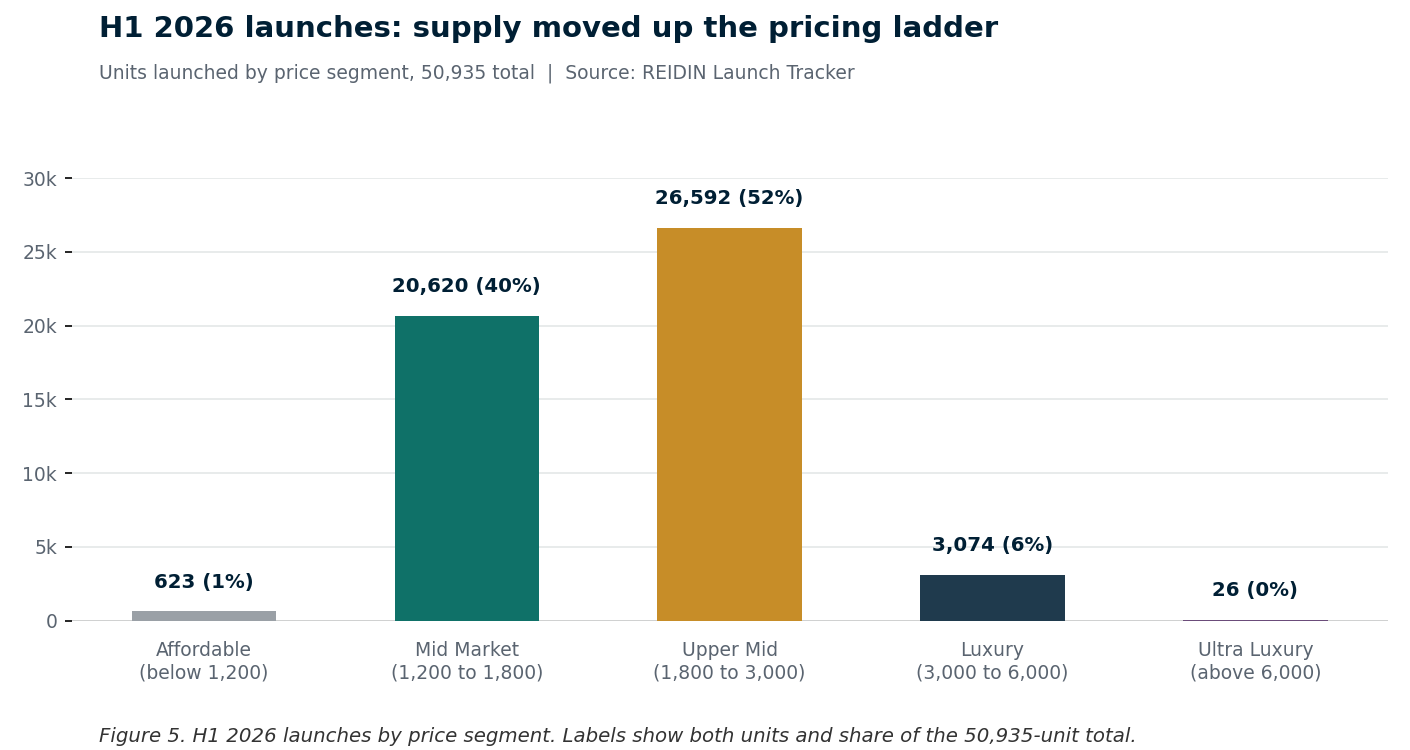
Developers have read the same data and adjusted their playbook. The H1 2026 launch tracker recorded 141 projects from 87 developers, representing 50,935 units at an average launch price of about AED 1,972 per square foot. Apartments accounted for 88% of units. The price mix also moved higher: 40% of units sat in the AED 1,200 to 1,800 band and 52% in the AED 1,800 to 3,000 band, while luxury and ultra luxury launches together represented 6%.
Payment structures remain central to the proposition. 27 projects, equivalent to 19% of the H1 2026 total, included a post-handover payment component. Such plans are more than sales incentives: they help developers accommodate buyer caution while supporting project cash flow. But the scale of the pipeline raises the standard of execution. New supply must be matched by credible delivery, sustained absorption and underlying resident demand.
4. Rental market and occupier demand
Occupier demand has underpinned the entire recovery. Residential rents fell to roughly AED 62 per square foot in 2021 and rose to about AED 119 in 2025. June’s reading of AED 116 was down 6.2% quarter on quarter and 2.5% year on year. The long recovery remains visible, but housing rents are no longer rising without interruption
The office market tells a complementary story of normalisation. After the dramatic post 2008 reset and a long plateau near AED 100 through the 2010s, office rents reached AED 205 per square foot in June 2026. The June reading remained roughly 7.5% above June 2025, even after easing from late 2025 levels. Residential and commercial space are therefore entering the next phase from different positions, with offices still supported by business formation and a tighter supply response.
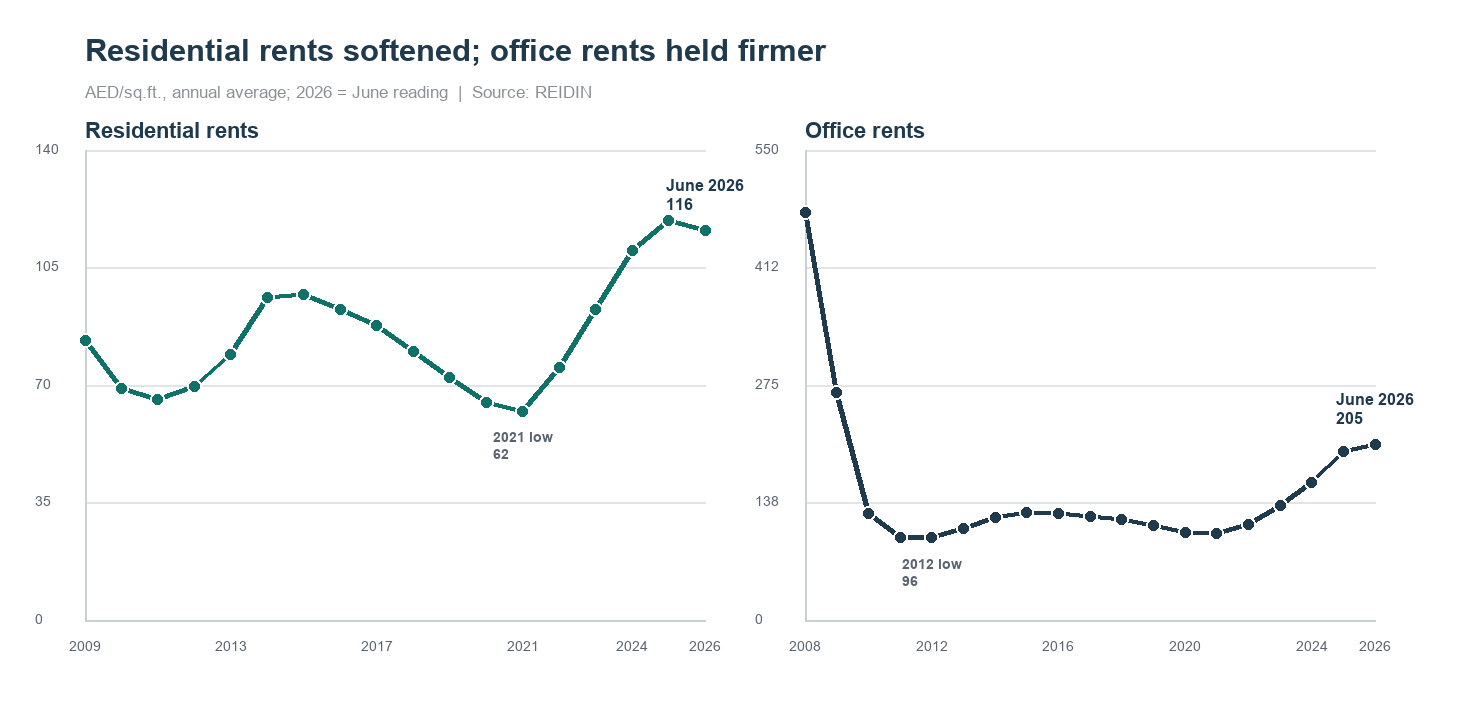
Figure 6. Residential and office rents. Historical troughs and the June 2026 readings are annotated directly.
5. Lessons for future growth
The encouraging conclusion from the data is that Dubai’s market has become structurally stronger, not just cyclically lucky. Sustaining that progress is now a matter of discipline rather than hope. Better data transparency, meaning information that is consistent, timely and granular, lets buyers, lenders and regulators act on evidence rather than narrative.
Stronger risk monitoring and more disciplined supply tracking would help ensure that the substantial off plan pipeline is delivered into demand rather than into oversupply. Wider use of automated valuation models and improved valuation standards would give banks and master developers a more accurate, real time read on collateral and pricing, reducing the lag that has historically amplified downturns.
Above all, deeper market intelligence turns a market that has learned to recover into one that can navigate a slower phase without surrendering its gains. Dubai has already proved it can come back stronger from shocks. H1 2026 shows that the next task is different: converting resilience into sustained, transparent and well-monitored growth.