
Cherif Sleiman, Chief Revenue Officer, Property Finder: The UAE’s commercial property sector in H1 2026 has transitioned into a mature, multi-speed market where success is more localized, than uniform.
While commercial rents showed some short-term easing or flatlined between the first and second quarters, the year-on-year sales numbers tell a much stronger story. Investors are largely looking past minor quarterly dips, choosing to focus on the long-term value of owning commercial space in the Emirates. This has kept overall transaction activity remarkably steady.
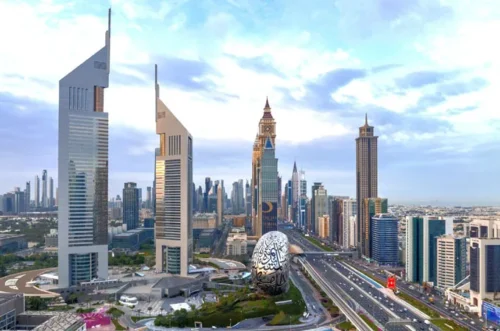
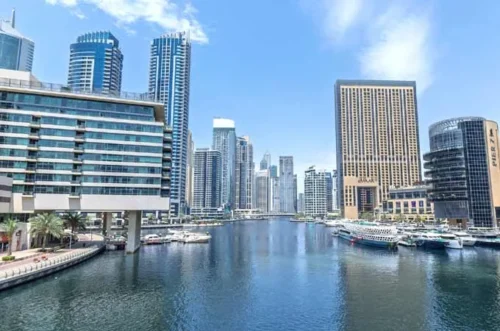
In Dubai and Abu Dhabi, the real story is where businesses are choosing to set up. In Dubai, popular neighborhood hubs like Jumeirah Village Circle (JVC) are seeing strong demand for local retail, while established business hubs like Business Bay and JLT remain the go-to choices for offices.
Over in Abu Dhabi, we see a very clear divide: newer, modern waterfront areas like Al Reem Island and Al Raha Beach are thriving, while older commercial and industrial districts like Mussafah are seeing much lower activity.
Modern companies are willing to pay a premium for high-quality spaces that help them attract high-caliber talent and raise their profile in front of clients.
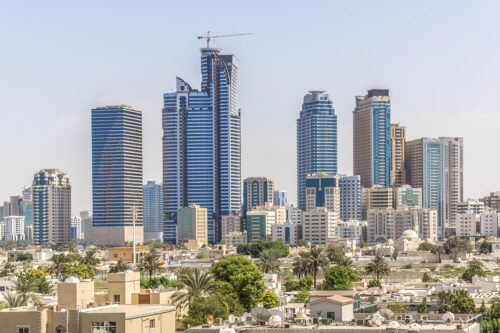
Meanwhile, Sharjah and Ras Al Khaimah are carving out their own unique paths. Sharjah is proving to be a highly selective market; popular office hubs like Al Majaz are doing well, but retail spaces across the emirate are seeing quite a bit of up-and-down movement. On the other hand, Ras Al Khaimah has turned into a major retail hotspot. Driven by massive tourism and luxury projects, areas like Al Marjan Island and RAK Central have seen huge year-on-year jumps in sale prices, even though the market took a natural breather in the second quarter after such a rapid climb.
As we head into the second half of 2026, the data points to a commercial sector defined by highly targeted demand. The stabilization of quarterly rents shows that tenants are negotiating harder, but the robust year- on-year sales growth proves that long-term confidence in the UAE’s economic foundation remains completely intact. Ultimately, success for the rest of the year will not come from relying on general market hype, but from securing prime, specific assets in hyper-local spots where businesses actually need to operate.
Dubai Areas
Rental rates in Q1 and Q2 2026, including H1 year-on-year comparison (in AED).
| No. | Property type | Key areas (Top Five) | Q1 2026 (Annual Average) | Q2 2026 (Annual Average) | Q1-Q2 % | H1 2025 (Annual Average) | H1 2026 (Annual Average) | YoY % |
| 1 | Retail shops | Meydan | 226,817 | 211,587 | -6.7% | 225047 | 219578 | -2.4% |
| Jumeirah Village Circle | 504,725 | 517,836 | 2.6% | 383456 | 511536 | 33.4% | ||
| Arjan | 416,663 | 427,969 | 2.7% | 354256 | 422612 | 19.3% | ||
| Deira | 656,991 | 631,753 | -3.8% | 398677 | 643855 | 61.5% | ||
| International City | 761,95 | 73,110 | -4% | 84276 | 74689 | -11.4% | ||
| 2 | Office spaces | Business Bay | 423,535 | 419,082 | -1% | 377836 | 421041 | 11.4% |
| Jumeirah Lake Towers | 478,867 | 473,250 | -1.2% | 364237 | 475870 | 30.6% | ||
| Bur Dubai | 95,512 | 110,923 | 16.1% | 144625 | 102370 | -29.2% | ||
| Sheikh Zayed Road | 601,986 | 560,440 | -6.9% | 505131 | 578394 | 14.5% | ||
| Deira | 65,071 | 63,659 | -2.2% | 52180 | 64391 | 23.4% |
sale prices in Q1 and Q2 2026, including H1 year-on-year comparison (in AED).
| No. | Property type | Key areas (Top Five) | Q1 2026 (Annual Average) | Q2 2026 (Annual Average) | Q1-Q2 % | H1 2025 (Annual Average) | H1 2026 (Annual Average) | YoY % |
| 1 | Retail shops | Jumeirah Village Circle | 8215843 | 7761700 | -0.055% | 7877813 | 8006440 | 0.016% |
| Meydan | 5043347 | 5825262 | 0.155% | 5204116 | 5347332 | 0.028% | ||
| Business Bay | 14755049 | 14045864 | -0.048% | 11676500 | 14442275 | 0.237% | ||
| Majan | 3257377 | 3064905 | -0.059% | 1872173 | 3154318 | 0.685% | ||
| Arjan | 10225924 | 10253272 | 0.003% | 5498026 | 10238054 | 0.862% | ||
| 2 | Office spaces | Business Bay | 10736365 | 10518038 | -0.02% | 6537204 | 10623592 | 0.625% |
| Jumeirah Lake Towers | 6052873 | 6032465 | -0.003% | 3823899 | 6042236 | 0.58% | ||
| Jumeirah Village Circle | 2354190 | 2552356 | 0.084% | 1957102 | 2452845 | 0.253% | ||
| Barsha Heights (Tecom) | 6298425 | 5653617 | -0.102% | 5629948 | 5973044 | 0.061% |
Sharjah Areas
Rental rates in Q1 and Q2 2026, including H1 year-on-year comparison (in AED).
| No. | Property type | Key areas (Top Five) | Q1 2026 (Annual Average) | Q2 2026 (Annual Average) | Q1-Q2 % | H1 2025 (Annual Average) | H1 2026 (Annual Average) | YoY % |
| 1 | Retail shops | Muwaileh Commercial | 95,057 | 104,413 | 9.8% | 99,093 | 99,356 | 0.3% |
| Al Majaz | 268,384 | 365,764 | 36.3% | 272,870 | 317,439 | 16.3% | ||
| Sharjah Industrial Area | 129,532 | 139,317 | 7.6% | 193,014 | 134,893 | -30.1% | ||
| Muwaileh | 102,993 | 62,840 | -39% | 62,384 | 88,796 | 42.3% | ||
| Al Sharq | 56,999 | 95,412 | 67.4% | 668,412 | 77,123 | -88.5% | ||
| 2 | Office spaces | Al Majaz | 130,091 | 115,342 | -11.3% | 73,995 | 121,627 | 64.4% |
| Al Qasimia | 139,287 | 109,251 | -21.6% | 86,899 | 122,765 | 41.3% | ||
| Al Gharb | 14,293 | 15,159 | 6.1% | 16,138 | 14,659 | -9.2% | ||
| Sharjah Industrial Area | 46,551 | 80,959 | 73.9% | 38,870 | 61,262 | 57.3% | ||
| Al Taawun | 148,147 | 84,676 | -42.8% | 212,477 | 126,391 | -40.5% |
Sale prices in Q1 and Q2 2026, including H1 year-on-year comparison (in AED).
| No. | Property type | Key areas (Top Five) | Q1 2026 (Annual Average) | Q2 2026 (Annual Average) | Q1-Q2 % | H1 2025 (Annual Average) | H1 2026 (Annual Average) | YoY % |
| 1 | Retail shops | Al Majaz | 1,046,020 | 1,308,804 | 25.1% | 1,301,959 | 1,133,752 | -12.9% |
| Muwaileh Commercial | 356,270 | 249,347 | -30% | 576,146 | 307,981 | -46.5% | ||
| Al Qasimia | 159,572 | 311,644 | 95.3% | 560,950 | 278,754 | -50.3% | ||
| 2 | Office spaces | Muwaileh Commercial | 2,673,088 | 2,504,277 | -6.3% | 2,764,495 | 2,635,893 | -4.6% |
| Aljada | 3,265,349 | 4,289,541 | 31.4% | 4,807,662 | 3,905,616 | -18.8% | ||
| Al Majaz | 1,119,411 | 1,348,666 | 20.5% | 959,867 | 1,242,423 | 29.4% | ||
| Al Khan | 1,496,504 | 1,290,000 | -13.8% | 1,306,573 | 1,407,593 | 7.7% |